As a data company, one of the ways we can help is to share market trends and insights. The hope is that this helps dealers and partners manage their businesses today and plan for what’s to come.
Note: due to a bug in Google Sheets, the interactive charts are blank on mobile. We recommend viewing this article on your laptop/desktop browser.
Questions to answer
The biggest question we set out to answer is how COVID-19 and the lockdowns are impacting the used car market. Are prices increasing or decreasing? Are dealers buying more cars to keep lots full, or are they holding off? How quickly are cars moving in the markets most impacted by COVID? How does all of this compare to last year?
To answer these questions, we pulled two data sets. The first spanned the US and includes approximately 27,000 dealerships accounting for 2.3 million used vehicles in both 2019 and 2020. We broke this data set down by DMA. For each DMA/City, we ended up with roughly 3,000 dealerships and 285,000 used units.
Inventory size
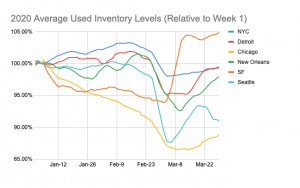
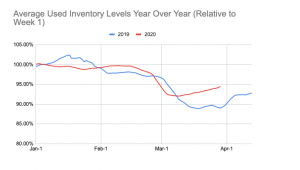
Except for San Francisco, strong February sales drove a drop in inventory counts across the cities most impacted by COVID to date. When you look at the year-over-year trends, you’ll notice the same pattern. Across these cities, inventory counts are increasing, except for Seattle. On March 19th, we started to see a drop in units.
Relative to a January baseline, 2020 has tracked reasonably close to 2019 levels until early March. This trend is one we’ll continue to monitor and report on.
Inventory age
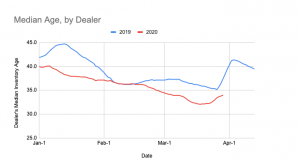
2020 got off to a better start compared to last year with the median age of used inventory tracking below or at 2019 levels. However, around the middle of March, age started to flatten out around 32 days and began to rise on the 21st. Compared to last year, we would expect an increase but then a quick turn around in the first few weeks of April. We’ll continue to update the data to see which direction this heads.
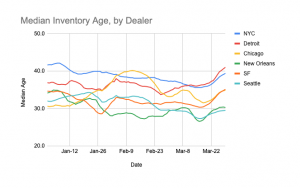
When we drill down to the DMA level, we notice the same trends we see nationally. While it’s still early, Seattle and New Orleans show a slight drop in age over the last few days.
Vehicle prices
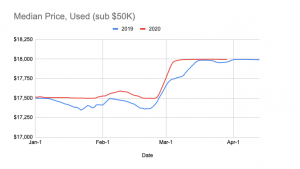
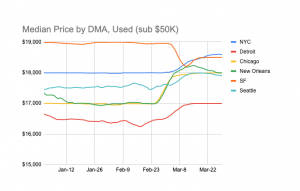
Across the same six DMAs, median prices are all higher in March compared to February. This behavior mirrors precisely what we saw last year at a national level. Note that both datasets only looked at sub $50,000 vehicles.
Price changes
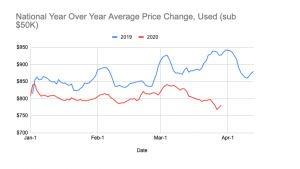
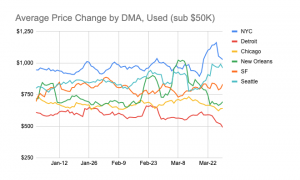
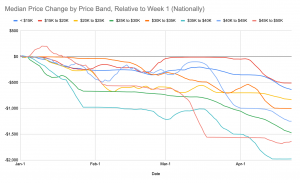
Next, we wanted to see if dealers were changing their pricing patterns, so we analyzed the average absolute value of daily price changes.
While we didn’t see any deviations in vehicle prices, we did notice a shift year-over-year in price changes. Last year at a national level, the average price change increased steadily in the middle of March through the beginning of April. However, in 2020 we see a different pattern, the average price change dropped steadily in the middle of March, only showing a slight uptick in recent days.
At a DMA-level, we start to see some divergence from the trends. In New York City, we see a considerable spike beginning on March 18th and then a trend downward beginning on the 26th. Seattle mirrors New York City, except their spike started on March 13th. Meanwhile, San Francisco didn’t show much deviation at all, with their price changes holding relatively steady throughout all of 2020.
New car inventory levels
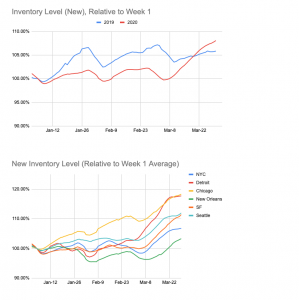
A lot of analysis has already been shared on new car sales. Our partner, JD Power, in particular, has some terrific data. One thing we wanted to add to their analysis is a tracker on new car inventory levels. We know OEMs have shuttered many of their plants, new car sales are down, and as expected, we see inventory levels rise.
Last year at this time, new car inventory levels were 105% higher than the first week of January. This year, the number of units today sits at 108%. At a DMA-level, we see the same trends. New car inventory levels are up significantly from the beginning of the year, and the trend line doesn’t appear to be flattening.
Our commitment
We sincerely hope you find this analysis helpful. Our Data Science team is monitoring the situation closely, and we will continue to update these charts and share new insights as we find them.
If you have suggestions or questions, please post them below and we will do our best to address them in follow-on updates.
Keep yourself updated on our COVID Impact page.
Additional resources
There are a lot of great companies putting out their own data on this topic. Here are the ones we’re following and we’d encourage you do check them out.
- JD Power Weekly COVID Impact Webinar
- Dealer Inspire’s COVID Impact Blog
- DrivenData’s COVID Impact Page
- LotLinx COVID Market Analysis
Let us know if you have other sources to add to this list.






Current Discussion Topics